Newfoundland and Labrador had signed a memorandum of understanding with the federal government that would make the province the main regulator and beneficiary of offshore wind once Bill C-49 passed, and 16 bays had been identified for development. My team took two of them, on opposite sides of the island: Conception Bay on the southeast coast and Bay of Islands on the west. The brief was to tell the provincial government which one should host its first offshore wind farm, and with which class of turbine.
The model
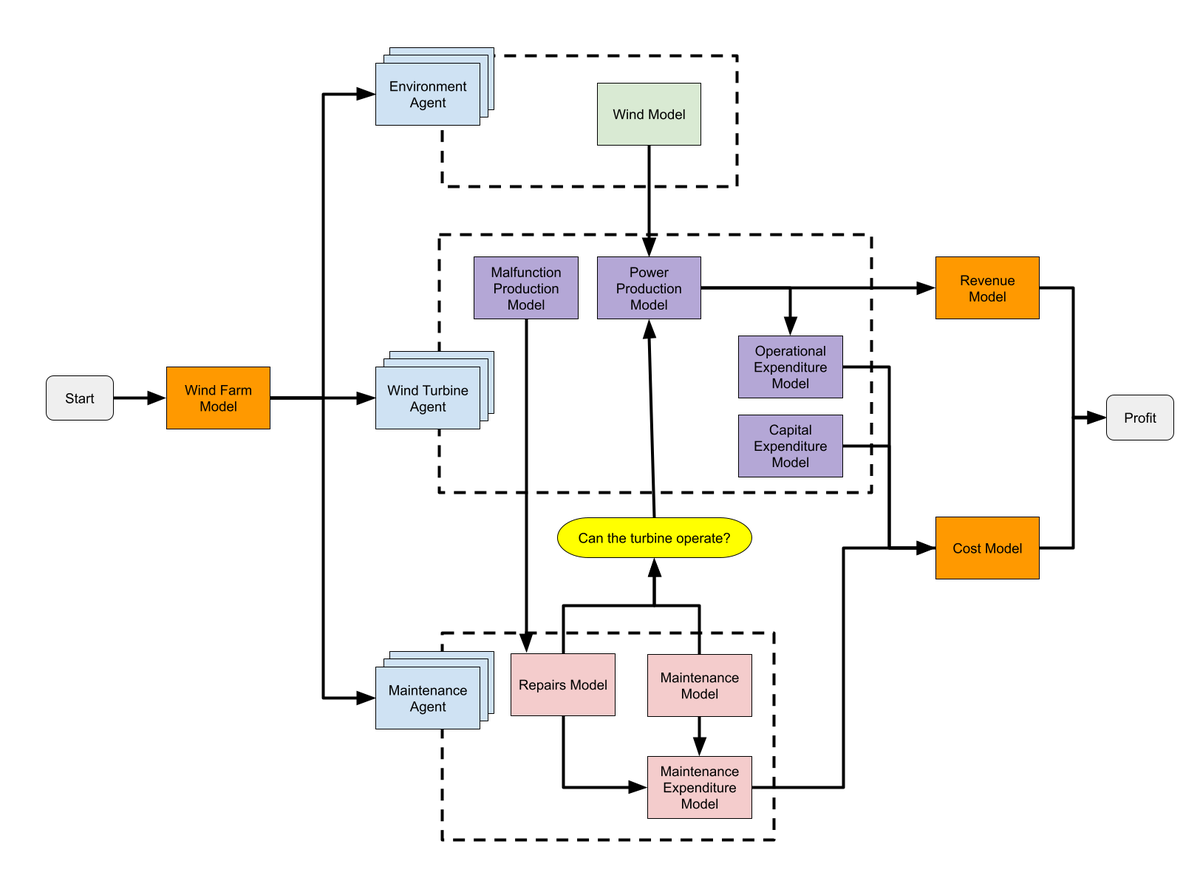
We built an agent-based simulation that steps through every day of a turbine’s 25-year service life, with three kinds of agents:
- Environment agent. Draws each day’s wind from historical data for the bay, then adjusts it to hub height with the wind profile equation, using a roughness length of 0.002 for open water.
- Wind turbine agent. Produces power from NREL power curves for IEC Classes 1, 2 and 3, and can break down. Each component, from the blades to the converter to the pitch system, fails at its own published rate, converted to a daily probability.
- Maintenance agent. Fixes broken turbines first, for up to 12 hours a day, and runs maintenance twice a year, in March and September, for up to 8 hours a day. Work that doesn’t finish carries over to the next day.
Each farm had 50 turbines rated at 8 MW, and power sold at $143/MWh. Capital, operating and maintenance costs added up to total cost, with maintenance growing by 5% of the capital cost every five years, and power times price gave revenue.
What it found
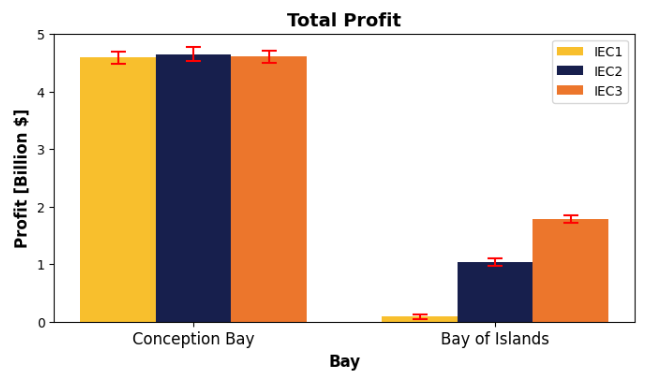
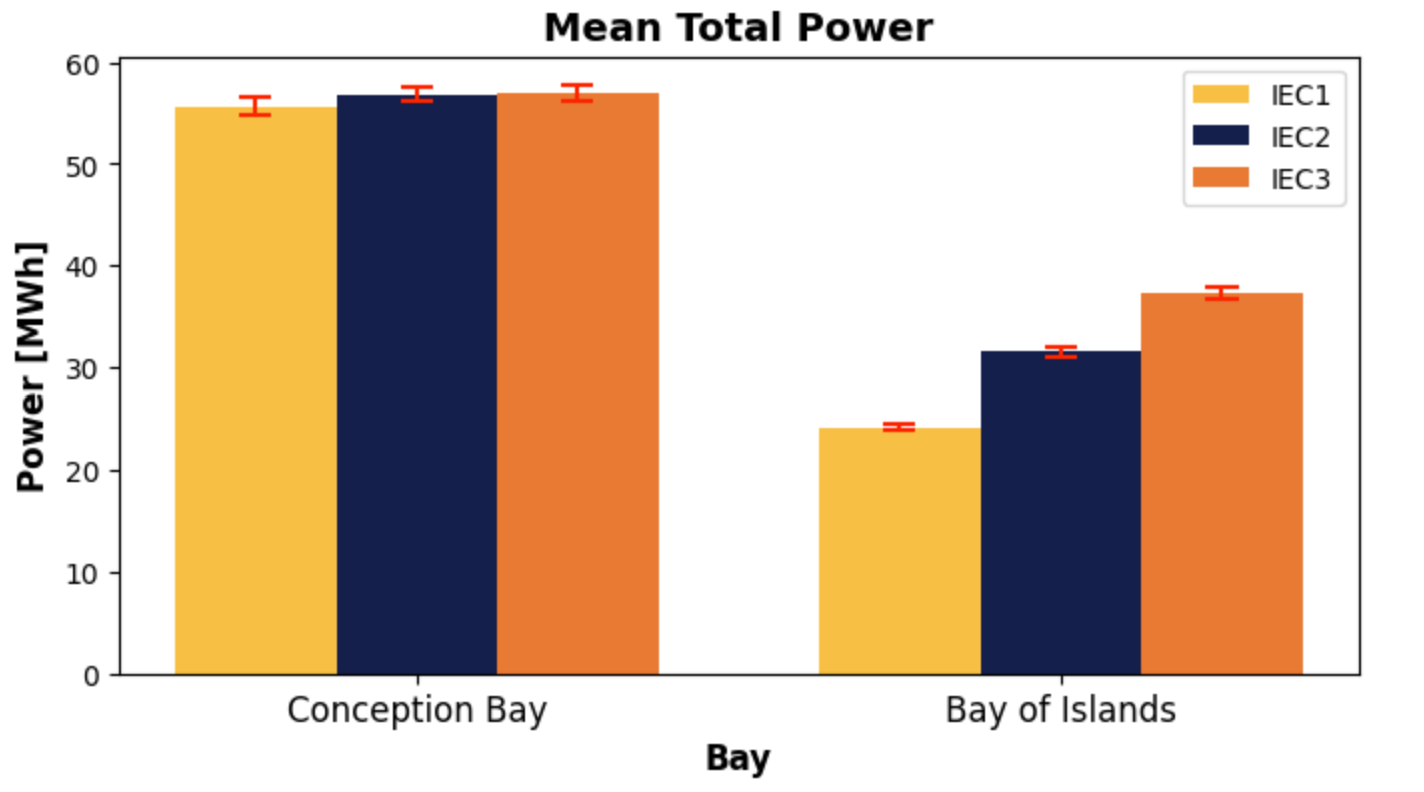
Costs barely differed between the bays: about $3.4 to $3.55 billion over 25 years in every scenario, most of it capital. Power did. Conception Bay produced roughly 1.5 to 2.3 times as much and earned about $4.6 billion in profit with any turbine class. In Bay of Islands, profit ranged from about $0.1 billion with Class 1 turbines to $1.8 billion with Class 3.
Why we picked the less profitable bay
On profit alone, Conception Bay wins. We recommended a Class 3 farm in Bay of Islands anyway. The communities around it, in the Humber District, had 15.1% unemployment against 12.2% on the Avalon Peninsula, a median employment income of $30,200 against $36,400, and an Indigenous population of 25.6% against 3.1%. The province’s own renewable energy plan calls for training residents to work in the industry and for closer work with Indigenous governments and organizations. St. John’s, the city on Conception Bay’s side of the island, already had the highest income inequality of any municipality in Atlantic Canada, partly because oil jobs pay so much more than everything else.
The Class 3 farm in Bay of Islands still made about $1.8 billion over 25 years in our model, roughly $72 million a year. That’s close to half of the $160 million deficit the province reported in its 2023 budget.
What the model left out
It skipped transmission lines, which can add 15 to 20% to the cost of a wind project, and it ignored inflation and what happens to turbines at the end of their life. It also used onshore power curves for offshore turbines, because those were the curves we could get. Each of those would move the numbers.
What I took from it
A model optimizes the number you give it. Ours was built to maximize profit, and it did that well, but the decision we were asked to make also had to weigh who the farm would employ and which communities it would serve. The most profitable site and the right site turned out to be different answers, and the useful thing the model did was show us exactly what the right answer would cost.